
One of the truly great things about social media and technology is the real-time analytics that can tell you what is happening around you.
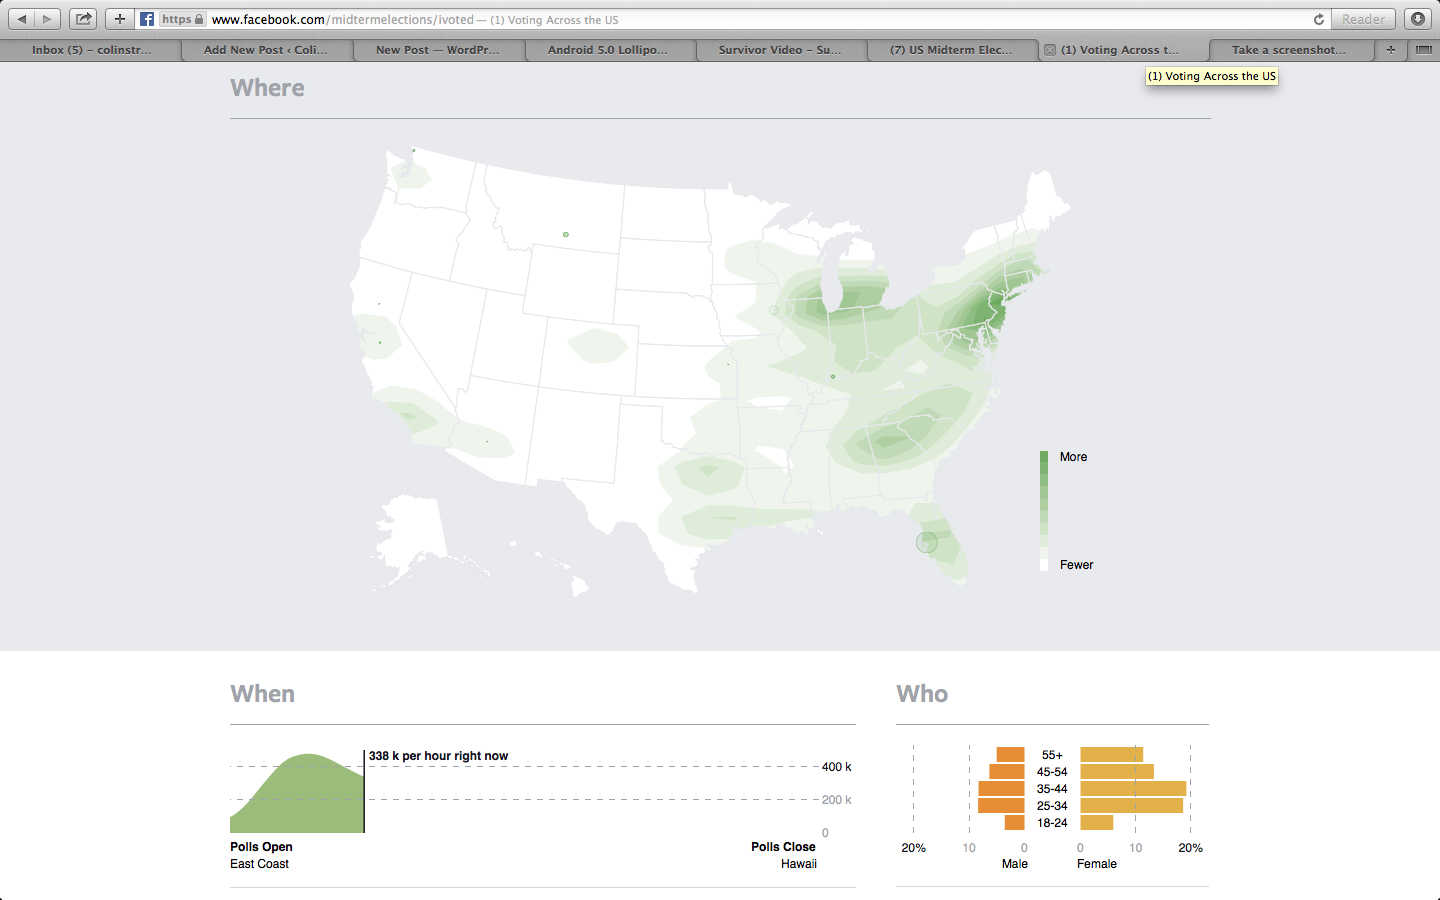
On Twitter it manifests as “trending” topics. This election on Facebook you can see voting participation as projected on a map of the United States that includes when Election Day across the country begins and ends, how many people are voting per hour, where they live, and some of their demographic information.
Check it out at the link below.
https://www.facebook.com/midtermelections/ivoted
This map is live and is constantly updating based on who is posting that they have voted. That button looks like this:

Make sure to click the “VOTE” button so that your friends and followers know you have stopped talking about what’s wrong with your city/state/country and started doing something about it.

